Phases of Data migration: Design

Now the fun begins! :)

In previous posts, we had focused on phases of data migration, and looked at planning and analysis stages in detail. In this post, we will focus on design of the tools and methodology for data migration.

What tools do we need? We will need at a minimum three tools for

* Extraction & transformation
* Load
* Validation

The first item to complete would be data mapping from source to target system. Based on the scope identified in the planning stage, have your business analysts dig deep and clearly identify all data sources, formats/rules and map them to the target system. This mapping exercise needs to be comprehensive for e.g. simply mapping name of the customer is stored in table XYZ and in column 1 in source system to table ABC and in column 2 is not enough. Why? In order to be thorough, you need to consider the maximum length of characters in your source system and check to see if your target system can handle this.

If your target system cannot handle this length, you have some choices (extend character size, truncate some customer names etc…). Regardless of decisions, this will have to be captured in your planning assumptions, socialized and then documented in your design document.

Word of caution: Don’t make assumptions! Don’t trust anyone! Including your data experts. Have your experts prove their knowledge of the data and their expertise. The reason for this seemingly paranoid approach is justified; in a lot of cases “knowing the data” means knowing the data base construct and limited knowledge of how the business uses the data or sometimes the other way around knowing the business logic but having no clue of persistence at the database layer.

Once your data mapping is done, you will have a clear idea of any data cleanup that needs to be done. Drive your team to think in terms of numbers and impact to schedule. The numbers should indicate the number of (1) records that have to be fixed/cleaned, (2) resources required to perform this clean up (3) hours/dollars effort/cost impact.

If data cleanup is required, consider this as a separate body of work. Don’t scavenge on the design activity to fund or resource the data cleanup. If you need additional help, make sure you raise awareness/jeopardy and ask for help.

Continuing on with design, ETL (extract transform and load) utilities can be challenging, but you don’t have to reinvent the wheel. Think outside the box, in most organizations that focus on KPI’s and performance metrics, there will be well defined tools to extract data. These tools can form the skeleton for your extraction tools. Review these carefully and document, what else you might need. If you are starting from scratch, try to get the experts to document the application layer and database layer. Once you have an idea of how source system manages and stores data, you can work towards extraction. With the advent of J2EE based systems, pure database centric extractions have become exceedingly difficult. The reason is that the logic and rules for extraction exist in the application layer and may not be clearly available in the database. In some cases, I have spent hours trying to create relationship diagrams using tools and that finally managed to construct diagrams based on combining application logic with some creative thinking (hacks) into the databases.

This activity of design and building tools to support data migration are no different from the equivalent standard SDLC tasks.

The key requirements for these tools are scalability and performance. Your tools should be able to perform the tasks within a timely manner and be able to handle the data set identified in the planning stage. While going through design, build and test iterations, I would highly recommend keeping a spreadsheet to record performance.

Thoroughly analyze the sequence for data extraction, load and validation. This is the sequence you need to solidify in the test phase and execute to during go-live. This sequence is usually identified as the last step and this is a common mistake. Instead of honing the strategy, data migration leads continue to spin their wheels.

"Disclaimer: The views and opinions expressed here are my own only and in no way represent the views, positions or opinions - expressed or implied - of my employer (present and past) "
"Please post your comments - Swati Ranganathan"

Process Mapping: Part 2.

In an earlier post, I had outlined how to construct a simple flowchart. In this post, let us see how can add more detail and enhance this flowchart using different techniques like SIPOC (six sigma), value stream mapping (lean), swim lane etc.

Swim lane diagrams: This is an extension of flowcharts and includes additional details like
  • Actors: The people, groups, teams, etc, who are performing the steps identified within the process.
  • Phases: These might reflect the phases of the project, different areas of the project, or any secondary set of key elements that the process flow needs to traverse to successfully complete this process.
Some times, these are also called cross functional flowcharts. This method of allows you to quickly and easily plot and follow processes and, in particular, the handoffs between processes, departments and teams and identify inefficiencies easily.
For example, if you look at the image shown, the flow chart is extended with additional information (phases are distinctly listed in the columns and the actors are listed in the rows).


SIPOC diagrams
: This is an extension of flowcharts and clearly indicates the suppliers, input, process, output and customers. In some cases, the process can be shown not only in a simple flowchart but also using swim lanes. SIPOC depiction of the process is very useful because it clearly identifies who supplies the information, which organization is impacted by the process and who generates the output and what the deliverables are.


Value stream mapping: This is an extension of flow charts & swim lanes and clearly identifies management and information systems that support the basic process. This methodology started as part of LEAN manufacturing with an emphasis on reducing wastes within manufacturing, but the benefits of using this across all business processes are valuable. The primary goal of this depiction is to clearly identify value added and non value added tasks performed in order to minimize wastes. It clearly outlines all tasks tasks, cycle time for each of the tasks so that the reviewer/management can identify how the process can be improved.


"Disclaimer: The views and opinions expressed here are my own only and in no way represent the views, positions or opinions - expressed or implied - of my employer (present and past) "
"Please post your comments - Swati Ranganathan"

Process Mapping: Part 1

Process Mapping refers to activities involved in defining a business process (Who does What, When, Where, how and Why). Once this is done, there can be no uncertainty as to the requirements of every internal business process.

It is a visual depiction of the sequence of events that occur from the beginning to the end of the business process.

Process maps can be constructed using a number of different techniques like flowcharts, swim lanes, process maps. Six Sigma methodologies recommend using a SIPOC approach. SIPOC stands for supplier, input, process, output and customers to clearly identify the handoffs, the inputs and outputs.

Let us start with the simplest approach, a flowchart.

How does one create a process map with a flowchart?

Step 1: Determine the Boundaries: Identify the start and end of the processes. Observe the process in action (if possible).

Step 2: List the Steps in the process. My recommendation is to start with post-it notes, identify the steps.

Step 3: Sequence the Steps: now place the post-it notes in the order

Step 4: Draw Appropriate Symbols

  1. Start with the basic symbols:
  2. Ovals show input to start the process or output at the end of the process.
  3. Boxes or rectangles show task or activity performed in the process.
  4. Arrows show process direction flow.
  5. Diamonds show points in the process where a yes/no questions are asked or a decision is required.
  6. Usually there is only one arrow out of an activity box. If there is more than one arrow, you may need a decision diamond.
Step 5: Finalize the Flowchart
  1. Check for completeness and duplication/redundancy
  2. Ask if this process is being run the way it should be.
  3. Do we have a consensus?
Here is an example of flow chart.


"Disclaimer: The views and opinions expressed here are my own only and in no way represent the views, positions or opinions - expressed or implied - of my employer (present and past) "
"Please post your comments - Swati Ranganathan"

Architect!

Over the last few years, there has been an increased focus on architecture within the IT domain. If you spend some time searching for people with “architect” in their title, you will find a multitude of titles like

(1) Enterprise architect

(2) Data architect

(3) Business process architect

(4) Application architect

(5) Solution architect

(6) Infrastructure architect

(7) Security architect

(8) Technology architect

Are all of these roles the same? Or are they complimentary?

I like the description posted on Wikipedia for the function/responsibility of different architects.

Enterprise architects are like city planners, providing the roadmaps and regulations that a city uses to manage its growth and provide services to its citizens. In this analogy, it is possible to differentiate the role of the system architect, who plans one or more buildings; software architects, who are responsible for something analogous to the HVAC (Heating, Ventilation and Air Conditioning) within the building; network architects, who are responsible for something like the plumbing within the building, and the water and sewer infrastructure between buildings or parts of a city. The enterprise architect however, like a city planner, both frames the city-wide design, and choreographs other activities into the larger plan.

These roles are different and serve different purposes. The roles are complimentary and the functions. In order to implement business systems and underlying infrastructure, specific architecture domains to be covered (Business, Data, Applications, Technology).

The key to success is engaging all the different facets of architecture to create a technology roadmap and strategy by which your organization can start from the current state and finish in the end state so as to achieve corporate objectives and goals.

"Disclaimer: The views and opinions expressed here are my own only and in no way represent the views, positions or opinions - expressed or implied - of my employer (present and past) "
"Please post your comments - Swati Ranganathan"

Phases of Data migration: Analysis

This is probably the trickiest part of the project. It all depends upon how well you know your data!

In an earlier post
, I had outlines the characteristics of good data. Focus on the following items in your analysis.

* Completeness,
* Conformity,
* Consistency,
* Accuracy,
* Duplicates, and
* Integrity

Based on your scope, try and identify all the sources of data (business systems like ERP, CRM, MES, PLM, document management systems etc.). Once you have the source identified, identify the quality of data.

If you have business analysts on your team, put them to work to

(1) document business rules and logic in source and target systems

(2) document gaps in data conformity to existing business rules and business processes

(3) document duplicates and plan of action to address duplicates

(4) document data integrity gaps and plan of action

(5) document plan to map data from source to target systems

Your business users should be assigned to

(1) assess completeness of data

(2) assess impact of data mapping

(3) assess data quality issued reported by business analysts

Based on the two bodies of work, you will have a good idea as to whether you need to clean your data prior to the move! In my experience, you will have some tough choices to make: Clean source data or design your extraction utilities to account for the cleansing actions!

I would recommend focusing on this aspect. “Garbage In is Garbage Out”

"Disclaimer: The views and opinions expressed here are my own only and in no way represent the views, positions or opinions - expressed or implied - of my employer (present and past) "
"Please post your comments - Swati Ranganathan"

Overcome Your Fear of Trying Something New

Great article on empowering yourself to expand your horizons.

Be Real, Be Whole and Be Innovative!

"Disclaimer: The views and opinions expressed here are my own only and in no way represent the views, positions or opinions - expressed or implied - of my employer (present and past) "
"Please post your comments - Swati Ranganathan"

Organized Information is the Next Moonshot?

I came across a very well written article on organized information!

Kudos to the author on succinctly writing about the value of organized information!

An excerpt from the article “Today's challenge is not having more information; it's devising a less-resource intensive way to collect it and an efficient way to filter and disseminate it.”

It is not what you know; it is how well and how quickly you can use what you know!

"Disclaimer: The views and opinions expressed here are my own only and in no way represent the views, positions or opinions - expressed or implied - of my employer (present and past) "
"Please post your comments - Swati Ranganathan"

Phases of Data migration: Planning

In an earlier post, I had outlined the key elements of a data migration plan. Now let us delve into the details.

(1) Scope: Clearly identify what data needs to be migrated over from the source system into the target system. Insights of subject matter experts are invaluable, Use them well! Work with your team, to identify what needs to be migrated, base the decision on how the business process will have to be executed in the new system and what information is essential to ensure success, effectiveness and efficiency. In every migration project I have managed, this is a crucial building block. At the end of this stage, you should have Estimate of the data assets (number of records, metadata, documents etc.)

(2) Criteria for a successful migration: this deliverable is closely tied to the scope of the data migration. Migrating the data into the target system without any errors doesn’t mean the project was successful; focus on what your customers will need! The criteria should start with error free migration and also include impact to customers if additional cycles are involved. This will take a few iterations, engage your subject matter experts and end users and work with them to refine the scope and define the criteria for success.

(3) Decision making authority of each of the data domains: In my experience, ownership of data is a tricky item. Different groups may own pieces of information that make up usable data to the enterprise! First identify the data elements and then start asking for who is the owner or steward of this data; this will lead you to decision making authority. Ensure that this person is always engaged, communicate often and well! Without their buy-in, scope and criteria for success will be meaningless.

(4) What data needs to be migrated: in almost all cases, all the data mayn’t be required. Consider the lifecycle of the information, in most cases the data can be divided into three buckets

a. Currently relevant to business

b. Historic information for archival / research purposes

c. Newly created, which may not have any significant value yet

Consider these buckets well, in most cases you might need to splice the data and truly identify all facets of usage. Dig deep and clearly identify usage patterns, this will indicate the value of your dataset and will provide insight into your final decision of partial or complete migration

(5) Timing: this is a key element of your plan. You need to clearly identify the time line for cutover into production. Work backwards from go-live date and identify spots for key tasks like development of extraction, loading and validation utilities, test runs (at least 2-3), stakeholder acceptance tests. You mayn’t have a clear idea of time needed to load into target system, work with your software vendor or benchmark with companies/individuals who have worked on similar systems and assess the time required for final migration.

(6) Requirements: focus on resource, system (hardware/software) and budgetary requirements. Gather as much information as possible from benchmarks and vendors to clearly identify what you might need to ensure success of this project. Start communicating the requirements to program sponsors, your resources and stakeholders, get alignment and then go secure the requirements.

(7) Roles and responsibilities: clearly define the roles and responsibilities for each and every one on your team. At a minimum, your team should include

a. Project manager or lead

b. Business user

c. Business analysts

d. Data architect and or data administrator

(8) Assumptions: this is a key element of any project, as you define the scope and success criteria, ensure that your assumptions are well documented and communicate them. Ensure your stakeholders, program sponsors and decision making authority are aligned. If you ever have to change any of the underlying assumption, secure alignment again.

(9) Risks and Risk Mitigation: every migration project is fraught with risk, if you remember an earlier post, I had outlined the success rate of projects and this paints a dismal picture. For every risk, ensure you have a risk mitigation plan. Document the risk and communicate your plans and secure alignment before proceeding.

"Disclaimer: The views and opinions expressed here are my own only and in no way represent the views, positions or opinions - expressed or implied - of my employer (present and past) "
"Please post your comments - Swati Ranganathan"

Phases of Data migration

Just like SDLC, I would like to propose distinct phases and stage gates that have to be met in order to complete data migration.

(1) Strategy

(2) Analysis

(3) Design (& build)

(4) Test

(5) Validation

In this post, let us focus on the strategy or planning phase. The first step is to put together a plan. The data migration plan should describe, in detail,

(1) Scope of the project

(2) Criteria for a successful migration

(3) Who is the decision making authority of each of the data domains (should be from the business organization)

(4) What data needs to be migrated (full or a subset)

(5) Timing

(6) Requirements from hardware, software perspective

(7) Resource requirements

(8) Budget requirements

(9) Roles and responsibilities

(10) Assumptions

(11) Risks

(12) Risk mitigation / Contingency

The plan also sets expectations up front with customers about the complexity of the migration, timing, and potential issues and concerns. Remember this is the first cut at the plan; this can be refined as move along your project. If you make any changes, remember to socialize with governance and accountability system.

"Disclaimer: The views and opinions expressed here are my own only and in no way represent the views, positions or opinions - expressed or implied - of my employer (present and past) "
"Please post your comments - Swati Ranganathan"

Rules For Successful Data Migration

(1) Clearly define the scope of the project

(2) Actively refine the scope of the project through targeted profiling and auditing

(3) Profile and audit all source data in scope before writing mapping specifications

(4) Define a realistic project budget and timeline, based on knowledge of data issues

(5) Secure sign off on each stage from a senior business representative

(6) Prioritize with a top down, target driven approach

(7) Aim to volume test all data in scope as early as possible at unit level

(8) Allow time for volume testing and resolving issues

(9) Segment the project into manageable, incremental chunks

(10) Keep total focus on the business objectives and cost/benefits throughout.

"Disclaimer: The views and opinions expressed here are my own only and in no way represent the views, positions or opinions - expressed or implied - of my employer (present and past) "
"Please post your comments - Swati Ranganathan"

Data Migration: Challenges & Joy! Part 2.

Forewarned is forearmed

Before we jump into details about migration methodologies, let us step back and understand some of challenges ahead of us. Whether you are migrating from a legacy system or a spreadsheet/database, you have to understand everything about your “SOURCE” system.

Common misconceptions about migration

• Data migration is an IT job function.
• We know our data!
• Data migration is one of the last steps taken before you go live with the new system.
• We can always change it after we go live.
• Acquiring legacy data is easy.
• Existing data will fit the new system.
• Existing data is of good quality.
• Existing data and business processes are understood.
• Documentation exists on data rules and formatting.
• We Don’t Need Tools or Special Skills
• Migration Is a Separate Activity

What you as the lead of the migration effort need to do is work with your team to dismiss these misconceptions.

Data migration is not a matter of copying data! In order to be successful at migrating data, one has to thoroughly understand
(1) Why is the data being migrated, significance and value to the organization?
(2) What data is being migrated?
(3) Where does the data reside currently?
(4) What are the rules for the data in the “Source” system and how is the target system setup?
(5) Who are the experts for each of the data domains?
(Hint: do not limit yourself to an IT resource)
(6) What is the success rate of migrating into this application?
(7) Who else in your industry segment has been through this activity?
(Hint: Do a benchmark)
(8) What do you need from a hardware/software perspective to support the data migration?
(Hint: Benchmarking and reference calls will provide this information)

Now that you armed with some answers which will highlight what you need to focus on, we can step back and think through our methodology.

Don't lose your humor, remember your mantra “I love data migration”

"Disclaimer: The views and opinions expressed here are my own only and in no way represent the views, positions or opinions - expressed or implied - of my employer (present and past) "
"Please post your comments - Swati Ranganathan"

Data Migration: Challenges & Joy!


What is data migration?


Data migration is the process of transferring data between storage types, formats, or computer systems.

Over the last decade, I have led multiple data migration efforts and found each one of these projects challenging and enriching. I keep swearing that I will not take up another but yet I always do. In a series of posts, I am going to share my experiences so that you may benefit from my lessons learnt and insights.

Common Data Migration Scenarios: when would you have a need to migrate data and create a project around this activity?
1. Mergers and acquisitions
2. Legacy system modernization
3. Enterprise application consolidation, implementation, or upgrade, such as an SAP ERP or CRM implementation
4. Master data management implementation
5. Business process outsourcing

Why are Data Migration Projects Are Risky: If you have been assigned as the lead for data migration, be aware of the heavy odds against you! Do your research and do it well.
Based on reference documents I have researched over the years (Gartner, Standish Group Study), I have found that
1. 84 percent of data migration projects fail to meet expectations
2. 37 percent experience budget overruns
3. 67 percent are not delivered on time

Why Data Migration Projects Fail: In earlier posts, I have outlined the importance of data management and the pitfalls of bad data management. These contribute to the overall success/failure of large implementation (and its data migration). Here are some reasons that have been attributed to failures of data migration.

1. Lack of methodology
2. Unrealistic scope
3. Improper understanding and use of tools
4. Inattention to data quality
5. Lack of experience

While data migration is essential to the success of implementation of a new application or business system, its role in the project often overlooked and underestimated. The common assumption is that tools exist to extract and move the data into the target application, or that data migration is something a consulting partner will handle. Often project teams tasked with data migration focus solely on the timely conversion and movement of data between systems. But data migration is not just about moving the data into the new application; it’s about making the data work once within the new application. This means that the data in the new application must be accurate and trustworthy for business users to readily transition from their legacy applications to adopt this new application.

In upcoming posts, I will outline the methodology I have used and why I have chosen this approach. Most of my team members would fondly remember my mantras of “Wash, Rinse & Repeat” and “I love data migration”. :)

"Disclaimer: The views and opinions expressed here are my own only and in no way represent the views, positions or opinions - expressed or implied - of my employer (present and past) "
"Please post your comments - Swati Ranganathan"

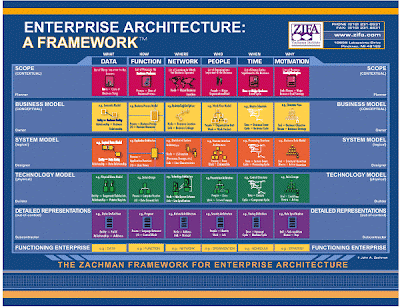
Zachman Framework: My Experience

As a rule of thumb, when I approached for business process improvements or systems development request, I ask the 6 W questions (What, How, Where, Who, When and Why). As I got better with this methodology, I came across SDLC best practices and finally found the Zachman framework.

What is the framework?

The Zachman Framework is a comprehensive, logical structure for descriptive representations (i.e., models) of any complex objects. It is neutral with regard to specific processes or tools used for producing the descriptions. The Framework, as applied to enterprises, is helpful for sorting out complicated technology and methodology choices and issues that are significant to general and technology management and identifying the kinds of models for a given project.

The Zachman Framework provides a common context for understanding a complex structure. The Framework enables communication among the various participants involved in developing or changing the structure. Architecture is the glue that holds the structure together. The Framework defines sets of architectures that contain the development pieces of the structure.

The Zachman framework gathers and refines principles from older methods. It has a structure (or framework) independent of the tools and methods used in any particular IT business. The framework defines how perspectives are related according to certain rules or abstractions. A framework takes the form of a 36-cell table with six rows (scope, business model, system model, technology model, components, and working system) and six columns (who, what, when, where, why, and how) as shown in the figure below.


The rows of the Zachman Framework define the various perspectives of the enterprise and the various roles in the enterprise using that information.
1. Scope (Contextual/Planner view): Definition of the enterprise’s direction and business purpose. It includes enterprise’s vision, mission, boundaries and constraints. Usually these are textual artifacts/definitions providing the context for each column for e.g. the “Why” column cell will contain the business goals, performance measures for each function. The “What” would contain the various high level data classes required etc. The idea here is to identify the requirements and the external drivers affecting the enterprise and perform business function modeling.
2. Enterprise Model (Conceptual/Owner’s view): At this level more focus is towards the business and the associated processes. At each column level information is gathered with the business processes in perspective. For e.g. to answer “Why” you will define the policies and procedure for the processes, the “How” would be the Business process definition itself, the “Who” would be the roles and responsibilities for each of these processes.
3. System Model (Logical/Designer’s view): This defines the business described row 2, but in more details. At this level the logical models are defined for each row cell. For e.g. A logical data model is created to identify the data flow for achieving the business data requirements specified in row 2. Similarly logical network models are created to understand the network setup required.
4. Technology model (Builder’s view): This describes how technology may be used to address the high level needs identified in the previous rows. Various technology related decision like decision for the DBMS type to use, the network elements required, and the access privileges for the users etc. are identified.
5. Detailed Model (Sub Contractor view): As we can understand at this level its is the deployment phase where the details are low level like database specifications constrained as per the physical models, network configuration, detailed user privileges and so forth produced.
6. Functioning system (User’s View) : Here the final implementation of the various systems is depicted and its impact to the users is mapped. Information like what data is being entered by users and getting stored in the database or the actual message flow happening over the deployed network and so forth is considered at this stage. The idea is to use this information for operations management, evaluation of the systems deployed etc.

I have spent some time reading about the weakness of this framework (for e.g. process/documentation heavy, little or no acceptance from development community), but I favor a business process centric approach. In my mind, all development activities should have a business value and justification. One way to clearly ensure that all stakeholders and departments understand the overall development program is through a visual display of the interactions of process, systems, data and business rules.

"Disclaimer: The views and opinions expressed here are my own only and in no way represent the views, positions or opinions - expressed or implied - of my employer (present and past) "
"Please post your comments - Swati Ranganathan"

What is PLM?

Product lifecycle management systems (PLM) were developed to help organizations control documentation, product structure and manage engineering change order (ECO, ECN, ECR etc.).

Product data management systems (PDM) have existed for a while prior to the development of PLM systems. The key differentiator between the two being lifecycle management in addition to data management. In most organizations, the engineering change process was

(1) Manual (process) with inefficiencies in handoffs between departments,
(2) Inability or lack of capability to capture financial impact
(3) Lack of awareness of extent/impact of changes and
(4) Unable to meet cycle time expectations.

As organizations continued to mature in their business processes (New product introduction, phase gate product introduction, product portfolio management, design for excellence [DFX, DFM], Excess and Obsolete inventory management, Effectivity dates) and business system usage (ERP, MRP, CRM), a need for a more comprehensive solution became compelling.

Research into product costs over its lifecycle has indicated that a focus on getting the design right earlier in the alpha/beta stages provides the maximum benefit. In order to get the design right so early can be tricky…effective business processes with right enabling technology will be the key to success to improve time to market and reduced costs across the lifecycle.

Three different sets of companies started developing PLM software
(1) traditionally CAD centric software companies, enhanced their PDM systems with additional capabilities
(2) ERP companies enhanced their core capabilities with enhanced workflow and document management features
(3) Pure PLM software vendors, which built their engines on basic needs of their customer base with extensive integrations to CAD (upstream data) and ERP/MRP/CRM systems.

There has been some amount of consolidation and over the years, PLM as a technology has matured and has added more and more features for e.g.
(1) Supplier collaboration
(2) Design / manufacturing outsourcing
(3) MES integration
(4) Digital rights management
(5) Collaboration
(6) Project management
(7) Regulatory and Environmental compliance tracking and management (RoHS, WEE, RoHS, FDA CFR etc.)
(8) Customer needs management
(9) Data Classification and Knowledge management
(10) Configuration management

And this list goes on…

In later posts, I will get in to details around each of these enhanced capabilities and future direction of PLM to support the enterprise.

"Disclaimer: The views and opinions expressed here are my own only and in no way represent the views, positions or opinions - expressed or implied - of my employer (present and past) "
"Please post your comments - Swati Ranganathan"

Knowledge management

I have long been a proponent of knowledge management – documenting insights, experiences and lessons learnt so that we don’t reinvent the wheel. In most cases, organizations and individuals tend to forget the lessons learnt in the past…

Over the last two decades or so, with the advent of enhanced document, content and metadata management solutions (ERP, PDM, PLM, Sharepoint, etc.) organizations have been able to document their best practices and lessons learnt to enable faster collaboration, innovation and problem solving.

There have been challenges such as the (1) need to classify and tag knowledge,(2) the need to clearly document experiences so that relative newcomers can come up to speed, (3) ability to search and find relevant data amongst thousands of documents (4) enforce creators and audiences of knowledge sharing to use the knowledge management system and positive value over time.

I was surprised to read an article on “When Knowledge Management Hurts” from http://blogs.harvardbusiness.org/vermeulen/2009/03/when-knowledge-management-hurt.html. An excerpt from this page “The advice to derive from this research? Shut down your expensive document databases; they tend to do more harm than good. They are a nuisance, impossible to navigate, and you can’t really store anything meaningful in them anyway, since real knowledge is quite impossible to put onto a piece of paper.”

I dug a little deeper and found “Does Knowledge Sharing Deliver on Its Promises?” from http://knowledge.wharton.upenn.edu/article.cfm?articleid=1841. This article clearly identified some of the shortcomings and listed some reasons why! The key takeaways from this article (my $0.02) are:
The first key implication is that it is unsafe to assume that more knowledge sharing is always better.
The second key implication is that it unsafe to assume that the net effects of using even the right type of knowledge are always positive. Instead, the design of a project team affects its ability to achieve the desired advantages of knowledge sharing.

As long as we continue to generate data, we should be able to leverage this! This will mean that users, employees and organizations will need to step back and understand the value in maintaining knowledge and experience within their boundaries and implement steps to capture, share and use knowledge effectively.

"Disclaimer: The views and opinions expressed here are my own only and in no way represent the views, positions or opinions - expressed or implied - of my employer (present and past) "
"Please post your comments - Swati Ranganathan"

The Business Case for Data Management (MDM, Data Quality, Data Governance)!

In an earlier post, I had outlined impact of poor data management. In this post I would like to discuss the data quality and need for governance/accountability systems and technological solutions like MDM (Master Data Management).
Characteristics of good data
In order to analyze the data stored with applications and used by end to end business processes, let us review certain characteristics to check if our data is of good quality and where/what do we need to work on:
Completeness: Is all the requisite information available? Are data values missing, or in an unusable state?
Conformity: Are there expectations that data values conform to specified formats? If so, do all the values conform to those formats? Are these formats specified in the same way across all your applications (data silos)?
Consistency: Do you have conflicting information about the same object? Are values consistent across applications and business processes (data silos)? Do interdependent attributes always appropriately reflect their expected consistency?
Accuracy: Do data objects accurately represent the “real-world” values they are expected to model? Are there variations in spelling or reference information (id related to customer, supplier and employees)?
Duplication: Are there multiple instances of the same data objects within your data set?
Integrity: What data is missing important relationship linkages? Does the data adhere to a predefined set of rules?
Timeliness: Can the right people access the right data at the right time?

The fundamental nature of data is that it changes continuously making it difficult for organizations to put the data to the best possible use and achieve benefits. Furthermore, much of the data within organizations resides on different systems (for example, ERP, CRM, Order management, Customer service, PDM, PLM etc). And it is often difficult to keep all these systems in sync.

Poor data quality isn’t always apparent in processing your day-to-day business transactions. The purchasing department, for example, may not see the difference between entering “3M” or “3M Corporation” or “3MCorp.” in a database. All of these seem to get the job done. But if you dig deep, you will find that this could potentially save $$$ in time and resources utilized in creating duplicates of data.

In most organizations, most resources are fully utilized and certain “nice to have” functions are dropped as a result. One such item that is commonly ignored is data quality!

The benefits of accurate data are clear. They include decreased product development and sales costs, better customer service and increased employee productivity. However, building the business case in order to launch a data quality management initiative has traditionally been a challenge!

As organizations face stiff demand and need to churn out products and services faster, there is an increased demand placed on the availability of good data to support faster and better decision making! Without a doubt, data has become the raw material of the information economy, and data governance is a strategic imperative.

In addition, increased requirements on timely and accurate data placed by regulatory compliances like (SOX, FDA 21 CFR Part 11, RoHS, WEE, Reach, HiPAA, Osha) have stretched the capabilities of process and business systems owners.

These demands have resulted in the development of data governance and technological solutions like MDM. Master Data Management (MDM) is the technology, tools, and processes required to create and maintain consistent and accurate lists of master data.

Some organizations hope to improve data quality by moving data from legacy systems (or consolidating data silos) to (ERP) and (CRM) packages. Other organizations use data profiling or data cleansing tools to unearth dirty data, and then cleanse it with an extract/transform/load (ETL) tool for data warehouse (DW) applications.

A word of caution: unless data quality and governance is approached from a top down manner with alignment from all levels, we will not be able to achieve accurate, complete and timely data! A program to address data quality is not to fix a business system or application, neither is it an implementation of technology solution like MDM, BI, DW. This program is to fix behavior, flow of information across the enterprise and improve operational effectiveness, efficiency, control and success. Merely focusing on technology will result in the same problems but in a different application.

"Disclaimer: The views and opinions expressed here are my own only and in no way represent the views, positions or opinions - expressed or implied - of my employer (present and past) "
"Please post your comments - Swati Ranganathan"

Decision Making

Thanks to Mala, I listened to a very interesting 6 minute monologue on decision making!
Recommend listening to it. Here's a link

"Disclaimer: The views and opinions expressed here are my own only and in no way represent the views, positions or opinions - expressed or implied - of my employer (present and past) "
"Please post your comments - Swati Ranganathan"

Has CAD delivered on its promise?

CAD (computer aided design) was a major boost to engineering productivity in the early 1980s. The capability of having drawings in digital forms, ability to overlay layouts to ensure form, fit and function were key enablers. As the usage of these software programs matured, the demand on additional features increased as well.

This led to the development of 3 D modeling capability; 3-D modeling was a huge step forward as it allowed for creating parts and assemblies and ability to
(1) Parametric modeling
(2) Capture design intent
(3) Associativity
(4) Finite element analysis capability
(5) Enhanced cam capability
(6) 3d rendering
(7) Interference / clearance checking

Over the last 10-15 years, the capability and maturity gaps between high-end and low-end CAD packages have reduced significantly. There has been some level of consolidation in the CAD space and software vendors have started creating more software packages to manage data (PDM, PLM) etc.

In my opinion, very few companies have mastered the art of the product data management specifically CAD data, which has resulted in lower re-use of existing components and wasted time and resources on recreating product data. Why is that?

Despite the promise of computer aided manufacturing (CAM) combined with the powers of comprehensive 3D modeling, very few companies have transitioned over to drawing less systems by utilizing CAM capabilities. Why is that?

Why is adoption of ASME 14.41 lagging? This standard supports the creation of 3D drawings with annotations and tolerance symbols. My $0.02, this could save $$$ in time and resources spent on creating product documentation via drawings.

I have long been a proponent of a single platform for product development using a single CAD tool. But this is an uphill battle in most large companies as companies go through acquisitions or relinquish control over product data management resulting in different groups using different platforms! This forms a major challenge to seamless collaboration. There have been a few promising software packages which allow for digital mockups by creating assemblies from different CAD packages. The major challenge here is that the mockups and changes done are not passed back on to the original CAD package. How can we enable cross platform collaboration?


Seamless integration with PLM/ERP

As the usage of PDM and PLM applications is increasing, there is an increased focus on the need product structure creation and maintenance. I would like to see complete integration between CAD and these applications so that editing of product structure (BoM) and attributes is seamlessly transferred in a bi-directional manner.

There has been some effort in analyzing part geometries to quickly identify if similar designs exist and promote re-use. This capability needs to be enhanced and promoted through out the user community.

In summary, we have come a long way but we can do more to improve how use the tools! We must innovate to try and identify more opportunities!

More postings on this topic to come...

"Disclaimer: The views and opinions expressed here are my own only and in no way represent the views, positions or opinions - expressed or implied - of my employer (present and past) "
"Please post your comments - Swati Ranganathan"

The 10 Questions Every Change Agent Must Answer

I came across this blog entry, from Harvard Business School. I highly recommend reading the article and going through each and every one of the questions to see whether you are on the right track!
It's time to do — and get — something different. Here, then, are ten questions that leaders must ask of themselves and their organizations —
1. Do you see opportunities the competition doesn't see?
2. Do you have new ideas about where to look for new ideas?
3. Are you the most of anything?
4. If your company went out of business tomorrow, who would miss you and why?
5. Have you figured out how your organization's history can help to shape its future?
6. Can your customers live without you?
7. Do you treat different customers differently?
8. Are you getting the best contributions from the most people?
9. Are you consistent in your commitment to change?
10. Are you learning as fast as the world is changing?

"Disclaimer: The views and opinions expressed here are my own only and in no way represent the views, positions or opinions - expressed or implied - of my employer (present and past) "
"Please post your comments - Swati Ranganathan"

Key Performance Indicators

Key Performance Indicators (KPI) are metrics used to help an organization define and evaluate how successful it is, typically in terms of making progress towards its long-term organizational goals.

KPI’s can be specified by answering the question, "What is really important to stakeholders?”. KPI’s evaluate business data against business goals and display current status by using easy-to-understand graphical indicators. For example, a KPI can use traffic light icons to indicate that customer satisfaction is exceeding, meeting, or failing to meet goals.

KPI’s are quantifiable measurements, agreed to beforehand, that reflect the critical success factors of an organization.

They will differ depending on the organization. A business may have as one of its Key Performance Indicators the percentage of its income that comes from return customers. A school may focus its Key Performance Indicators on graduation rates of its students. A Customer Service Department’s Key Performance Indicators could be percentage of customer calls answered in the first minute. A Key Performance Indicator for a social service organization might be number of clients assisted during the year.

Guidelines: refer to the posting Metrics

Categorization of indicators
KPIs can be summarized into the following sub-categories:
Quantitative indicators which can be presented as a number.
Practical indicators that interface with existing company processes.
Directional indicators specifying whether an organization is getting better or not.
Actionable indicators are sufficiently in an organization's control to effect change.
Financial indicators used in performance measurement

Are KPI’s and metrics interchangeable?

The term "metric" is generic. It is typically used to mean just about any sort of measurement applied to gauge a particular business process or activity. KPI’s are metrics, too, but they are "key" metrics. KPI’s are meant to gauge progress toward vital, strategic objectives usually defined by upper management, as opposed to the more generic metric used to measure a more mundane (i.e., less strategic) process. The goal is to foster greater visibility, better execution of strategy, faster reaction to opportunities and threats, and improved collaboration and coordination across key business operations

In previous posts, I had outlined SWOT analysis and setting strategy based on the analysis. KPI’s provide a way of measuring progress towards accomplishing the goals set by the strategy. In this post, I have outlined the definition and details regarding KPI’s and in upcoming posts, I will discuss performance management and evolution of balanced scorecards.

"Disclaimer: The views and opinions expressed here are my own only and in no way represent the views, positions or opinions - expressed or implied - of my employer (present and past) "
"Please post your comments - Swati Ranganathan"

SWOT Strategy

In a previous blog entry, I had described how to go about SWOT analysis. Now that you have completed the analysis and created a matrix of your Strengths, Weakness, Opportunities and Threats, let us discuss how you can construct a strategy to address your findings.

You will have to match each component with one another. For example, match the internal strengths with external opportunities and list the resulting Strengths / Opportunities strategies in the matrix chart. This will result in four strategy types, which are:

S-O strategies pursue opportunities that match the company’s strengths. These are the best strategies to employ, but many firms are not in a position to do so. Companies will generally pursue one or several of the other three strategies first to be able to apply Strengths-Opportunities strategies.

W-O strategies overcome weaknesses to pursue opportunities. Your job is to match internal weaknesses with external opportunities and list the resulting Weaknesses-Opportunities strategies

S-T strategies identify ways that the firm can use its strengths to reduce its vulnerability to external threats. Your job is to match internal strengths with external threats and list the resulting Strengths-Threats Strategies

W-T strategies establish a defensive plan to prevent the firm’s weaknesses from making it susceptible to external threats. Your job is to match the internal weaknesses with external threats and record the resulting Weaknesses-Threats Strategies

Here are some examples on the type of strategies based on SWOT analysi:

Strength-Opportunity Strategies

Expand
Increase advertising
Develop new products
Diversify

Strength-Threat Strategies
Diversify
Acquire competitor
Expand
Re-engineer

Weakness-Opportunity Strategies

Joint venture
Acquire competitor
Expand

Weakness-Threat Strategies

Divest
Retrench
Restructure

"Disclaimer: The views and opinions expressed here are my own only and in no way represent the views, positions or opinions - expressed or implied - of my employer (present and past) "
"Please post your comments - Swati Ranganathan"

Pareto Analysis

Pareto charts provide a tool for visualizing the Pareto principle, which states that a small set of problems (the "vital few") affecting a common outcome tend to occur much more frequently than the remainder (the "useful many"). A Pareto chart can be used to decide which subset of problems should be solved first, or which problems deserve the most attention.

The Pareto principle (also known as the 80-20 rule, the law of the vital few, and the principle of factor sparsity) states that, for many events, roughly 80% of the effects come from 20% of the causes. Vilfredo Pareto observed that 80% of the land in Italy was owned by 20% of the population.

This principle can be applied to quality improvement to the extent that a great majority of problems (80%) are produced by a few key causes (20%). If we correct these few key causes, we will have a greater probability of success. It is the basis for the Pareto diagram, one of the key tools used in total quality control and Six Sigma.

Step by step process:
1 List all elements of interest
2 Measure the elements, using same unit of measurement for each element.
3 Order the elements according to their measure
4 Calculate the percentage for each element out of the total measurement
5 Accumulate the percentage from top to bottom to equal 100%.
6 Create a bar and line graph, line representing cumulative percentage.
7 Work on the most important element first.


"Disclaimer: The views and opinions expressed here are my own only and in no way represent the views, positions or opinions - expressed or implied - of my employer (present and past) "
"Please post your comments - Swati Ranganathan"

Quotes on Innovation & Leadership

I recently came across a few quotes which I found very inspiring and felt that these captured the essence of Innovation & Leadership.

Enjoy :)


The ability to convert ideas to things is the secret to outward success. (Henry Ward Beecher)

A wise man will make more opportunities than he finds. (Francis Bacon)

Six essentials for success: Sincerity, personal integrity, humility, courtesy, wisdom and charity. (Gerald Roque)

In everything that ends well defined are the secret of durable success. (Victor Cousins)

People seldom become famous for what they say until after they are famous for what they’ve done. (Cullen Hightower)

It is curious that physical courage should be so common in the world and moral courage so rare. (Mark Twain)

Things that matter most must never be at the mercy of things which matter least. (Goethe)

The significance of a man is not what he attains but in what he longs to attain. (Kahlil Gibran)

If you don’t know where you are going, you’ll end up somewhere else. (Yogi Berra)

People who are quick to take offense will never run short of supply. (Unknown source)

The greatest enemy of the truth is very often not the lie - deliberate, contrived and dishonest - but the myth - persistent, persuasive and unrealistic. (John F. Kennedy)

The greatest of all faults is to be conscious of none. (Thomas Carlyle)

The biggest idiot can sometimes ask the questions the smartest man can’t answer. (Unknown source)

Our plans miscarry because they have no aim. When a man does not know what harbor he is making for, no wind is the right wind. (Seneca)

In the absence of clearly defined goals, we become strangely loyal to performing daily acts of trivia. (Unknown source)

The woods are lovely
dark and deep.
But I have promises
to keep
And miles to go before
I sleep.
(Robert Frost)

"Disclaimer: The views and opinions expressed here are my own only and in no way represent the views, positions or opinions - expressed or implied - of my employer (present and past) "
"Please post your comments - Swati Ranganathan"

SWOT Analysis

SWOT Analysis is a methodology used to evaluate the Strengths, Weaknesses, Opportunities, and Threats involved in a project or in a business venture. It involves identifying the internal and external factors that are favorable and unfavorable to achieving success.

Successful businesses and individuals build on their strengths, correct their weaknesses and protect against internal vulnerabilities and external threats. They can monitor overall business environment and quickly identify and exploit new opportunities faster than competitors.

SWOT analysis can be used for all sorts of decision-making, and the SWOT template enables proactive thinking, rather than relying on habitual or instinctive reactions.

SW – Strengths & Weakness are influenced by internal factors – the strengths and weaknesses of the organization or individual. These are competences and resources that the organization or individual possesses and that are under their control.

OT - Opportunities & Threats are influenced by external factors that an organization or individual faces from trends and changes in their environment. These external factors are not under the control or influence of the organization or individual

How do I go about it?

(1) Start with an objective

(2) Now/Present: identify your strengths and weakness,

a. Strengths

i. What are your advantages?
ii. What do you do well?

b. Weaknesses

i. What could you improve?
ii. What do you do badly?
iii. What should you avoid?

(3) Future/What might be?: identify potential opportunities and threats

a. Opportunities

i. Where are the good opportunities in front of you?
ii. What are the interesting trends you are aware of?

b. Threats

i. What obstacles do you face?
ii. What is your competition doing?
iii. Is changing technology threatening your position?
iv. Could any of your weaknesses seriously threaten your potential?

(4) Develop a plan of action to

a. maximize strengths to turn them into opportunities,

b. maintain and leverage strengths

c. convert weakness into strengths, create a remedial action plan to improve

d. counter or minimize threats, if not threats will turn into weakness

"Disclaimer: The views and opinions expressed here are my own only and in no way represent the views, positions or opinions - expressed or implied - of my employer (present and past) "
"Please post your comments - Swati Ranganathan"

What is the impact of poor data management?

• Reduced customer satisfaction due to incomplete, out-of-date or incorrect data
• Inability to bring new products to market quickly
• Depleted or overstocked inventory
• Loss of revenue due to billing errors and lost opportunity
• Lost manufacturing time due to inaccurate parts ordering
• Regulatory fines due to noncompliance.

the list could go on and on, these bullets are to give you a sense for the need to better manage data!

"Disclaimer: The views and opinions expressed here are my own only and in no way represent the views, positions or opinions - expressed or implied - of my employer (present and past) "
"Please post your comments - Swati Ranganathan"

Marcel Proust on Discovery/Innovation

"The only real voyage of discovery consists not in seeking new landscapes but in having new eyes"

Do you see opportunities where others don't? Do you know where to look for new ideas?

On a personal note, I have found that this approach of "fresh eyes" is very useful!

"Disclaimer: The views and opinions expressed here are my own only and in no way represent the views, positions or opinions - expressed or implied - of my employer (present and past) "
"Please post your comments - Swati Ranganathan"